Geospatial
Visualization
Visualization
School of Architecture
Map from the Detroit Expeditions organized by Bill Bunge in the late 1960s (Colvard 1971, 18).
Check - in !! (not for grade)
Today's Goals
- Finish join demonstration
- Initial Sketch Presentations
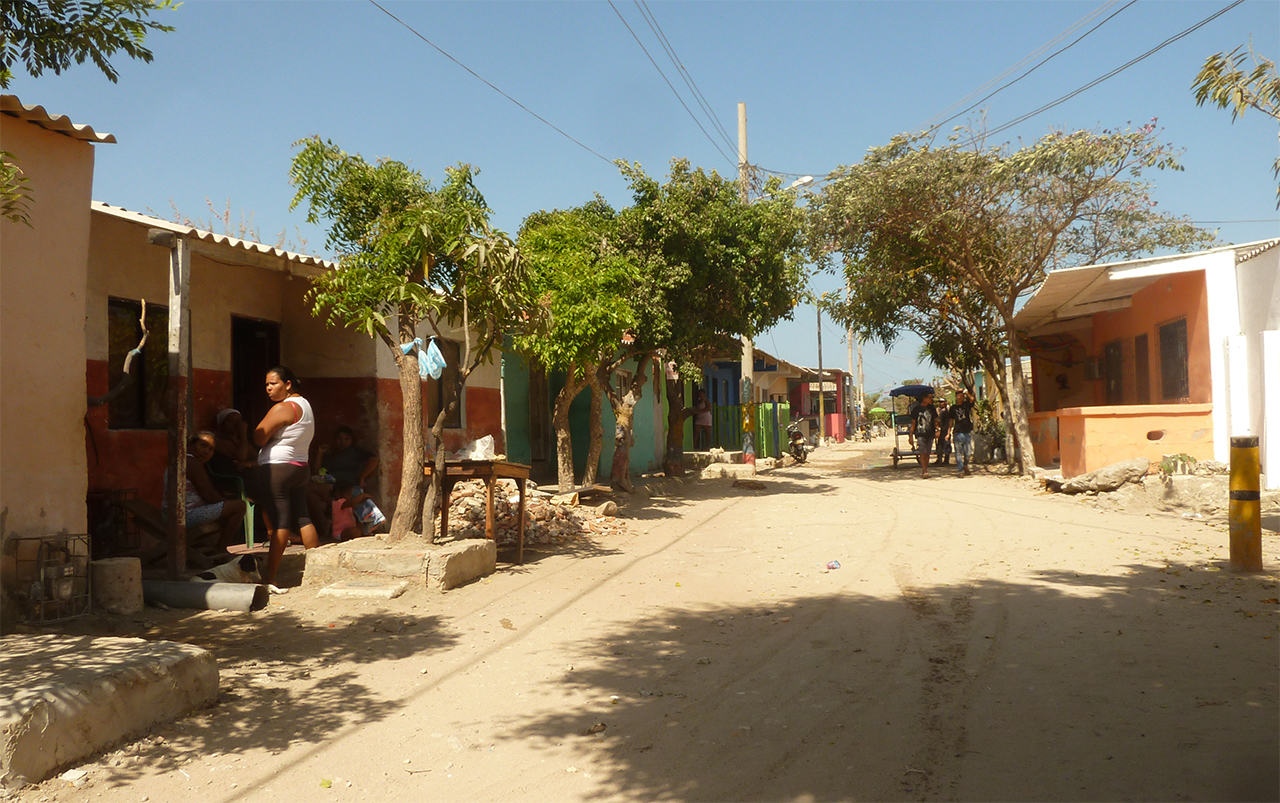
- Mapping Las Flores (presentation)
- Creating Data Exercises
- Choose next Field presentations
Participatory Mapping in Las Flores
Some exercises
- Creating vector data
> enter data by hand - Editing vector data
> modify geometries and attributes
Creating vector data (#1)
- Remember: the project file/folder is NOT the data
- Create a new map project with data folder - DATA MANAGEMENT
- When we edit the project we are editing the layout, the symbology, the labels, etc.
- When we edit the data layers we are editing the geometries and the attributes
- ^^ these are different things
- Create a data layer
- In QGIS: menu: Layer > create > GeoPackage
- In ArcGIS Pro: ArcCatalog window > geodatabase folder (gdb) > right click > new > Feature Class
- Call it "swamps," make sure it is polygon, give it the local Florida state plane CRS, and click next
- Define the columns you want ...
- Create a "Name" column that is text.
- Create an "Area" column that is Decimal or Double.
- click next
Creating vector data (#2)
- Make Layer editable
- QGIS - the little yellow pencil
- QGIS - look for the editing icons in tool bars
- ArcGIS - Edit tab -> Create
- ArcGIS - Look for correct polygon tool in the correct layer on the right
- Add features
- Add a base map with satellite imagery
- Locate a swamp
- With the polygon tool selected, start to draw
- Try to maintain one scale
- Right click to finish sketch/part
- Remember to save edits often
(layer, not the project)
Creating vector data (#3)
- Edit attributes ArcGIS Pro
- Open the attribute table for swamps
- Enter a name (or names) for your swamp(s)
- Right click the "Area" column and choose "Calculate Geometry"
- Set "Property" to "Area (geodesic)" and "Units" to "Acres"
- Set "Coordinate System" to "swamps" and click "ok"
- Edit attributes QGIS
- Open the attribute table for swamps
- Enter a name (or names) for your swamp(s)
- Open the field calculator and update the existing field "Area"
- From the middle list of funcitons and columns, find "Geometry and select "$area"
- In the expression box on the left make it look like (for sq ft to acre conversion):
$area / 43560
- click OK
- Turn off layer editing
Editing vector data
- Remember: the project file/folder is NOT the data
- Make Layer editable
- QGIS - the little yellow pencil
- ArcGIS - right click > make layer editable
- Modify features
- add, delete, or move entire feature
- for one feature: add, delete, or move vertices
- modify attribute data for individual features (in attribute table)
- Remember to save edits often (not the project)
- Turn off layer editing
Symbolizing the swamp
- An image based polygon fill
- Find a grass like png online (open source) and resize to about 60px and save in your project folder
- ArcGIS
- Layer symbology ... (double click icon in table of contents)
- In symbology pane find "Properties" tab
- Change the fill color to a light green that is somewhat transparent
- With the wrench icon, add a new symbol fill layer
- Select "Picture fill" for fill type
- With the picture button, locate your save file
- Set size to about 10pt and click "Apply"
- QGIS
- From layer properties, click the symbology pane
- Under "Single Symbol" click "Simple Fill" and set the color to a dull somewhat transparent green with no border
- On the right click the "+" icon and add another layer to the symbology; select "Raster image fill"
- With the selector directly below, locate the file and load
- set the size to about 12 pixels
- Click OK
The Homework
- Add some butterflies, symbolize, label, and create a layout.
- Create a point layer called "butterflies" with attributes: "common_name" and "scientific_name"
- Edit the layer and add a few butterflies on your swamp, make sure to edit the attributes and fill in fields (can be made up)
- Find a butterfly image (png) and symbolize the layer with the image you found
- Label the layer with the "common_name"
- Make a simple layout with title, legend, and scalebar
- Include a textbox with the sources of your data (traced from ..., made up by ...)
- Take a screenshot and send along

