GIS, Maps, and Climate Resilience
Dr. Timothy Norris : tnorris@miami.edu
Today's Goals
- Review Capstone
- Introduction to GIS and storytelling
- Introduction to ArcGIS Online
- Little River ArcGIS Online Tutorial
- Reflection on tutorial and GIS experience
- Brainstorm data needs
- Identify next steps for Capstone
Urban Resilience
- Ecological Resilience (Holling 1973)
- ... persistence of relationships in a system, ... and ability of system to absorb changes in state variables, driving variables, and parameters and still exist ...
- ... a measure of the amount of disturbance a system can take before collapsing into an alternate configuration ...
- Leads to Adaptive Management Cycles
Adaptive Management
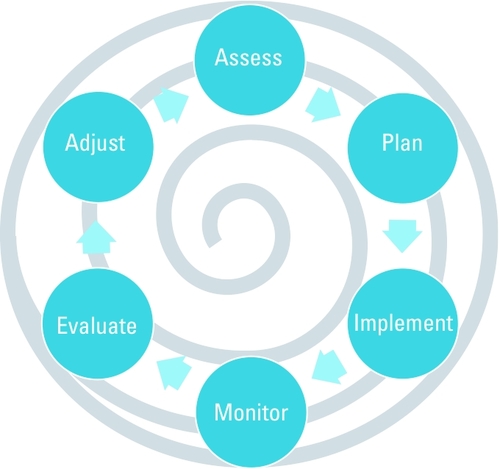
Where do maps fit in this cycle?
Urban Resilience
Urban resilience is the capacity of a city’s systems, businesses, institutions, communities, and individuals to survive, adapt, and grow, no matter what chronic stresses and acute shocks they experience.
The Wikipedia entry on Urban Resilience also has good definitions and resources.
What GIS data can we use to measure, analyze, or understand Urban Resilience??
Data for Urban Resilience
Physical
- Climate
- temperature
- air pollution
- rainfall
- Geology
- foundation conditions
- unique or valuable deposits
- Physiography
- slope
- riparian habitat
- surface drainage
- Hydrology
- aquifers
- drainage basins
- recharge zones
Values
- Scenic
- forests
- features
- riparian
- beaches
- Development
- commercial
- residential
- industrial
- resource extraction
- Conservation
- endangered species
- endemic species
- water
- soil
Land Use
- Urban Zoning
- residential
- commercial
- industrial
- recreational
- Historic
- buildings
- cultural sites
- educational
- Recreational
- active
- passive
- Conservation
- animal habitats
- ecosystems
- surface drainage
Capstone Project
Phases
Phases
Phase
- Literature Review
- Establish Focus Area
- Data Collection
- Final Recommendations
Due Date
- October 10th (module 6)
- October 24th (module 7)
- October 31st (module 10)
- November 21st (final class)
Capstone Project
Scale of Analysis
Scale of Analysis
- At least two scales:
- County-wide for context
- Little River AAA for final recommendation
- Additional smaller scales (i.e. neighborhood) are encouraged
Capstone Project
Recommendation Guidelines
Recommendation Guidelines
- Can be: projects, programs, or policy (or a mix of the three)
- Should be aspirational, but realistic
- Must be linked to evidence and prior work
point cloud: Chris Mader and Amin Sarafraz


100 year sea level rise
Surface Temperature 2011-2018
Three [ 5 ] things we do with computers
- [ load ]
- Select
- Manipulate
- Save
- [ repeat ]


