|
Tool of Statecraft
as far back as Rome
|
Estate map
late 13th or 14th C onwards
|
Palomino, Diego (1549). Traça de la conquista del capitán Diego Palomino: [de las Relaciónes Geográficas, Provincia de Chuquimayo, Perú]
Kain, R. J. P., & Baigent, E. (1992). The Cadastral Map in the Service of the State: A History of Property Mapping. Chicago: University of Chicago Press.
Timothy B Norris
Librarian Associate Professor, Data Science
UM Libraries - Institute for Data Science and Computing
tnorris@miami.edu
You can follow along at:
https://bit.ly/3HROmSf
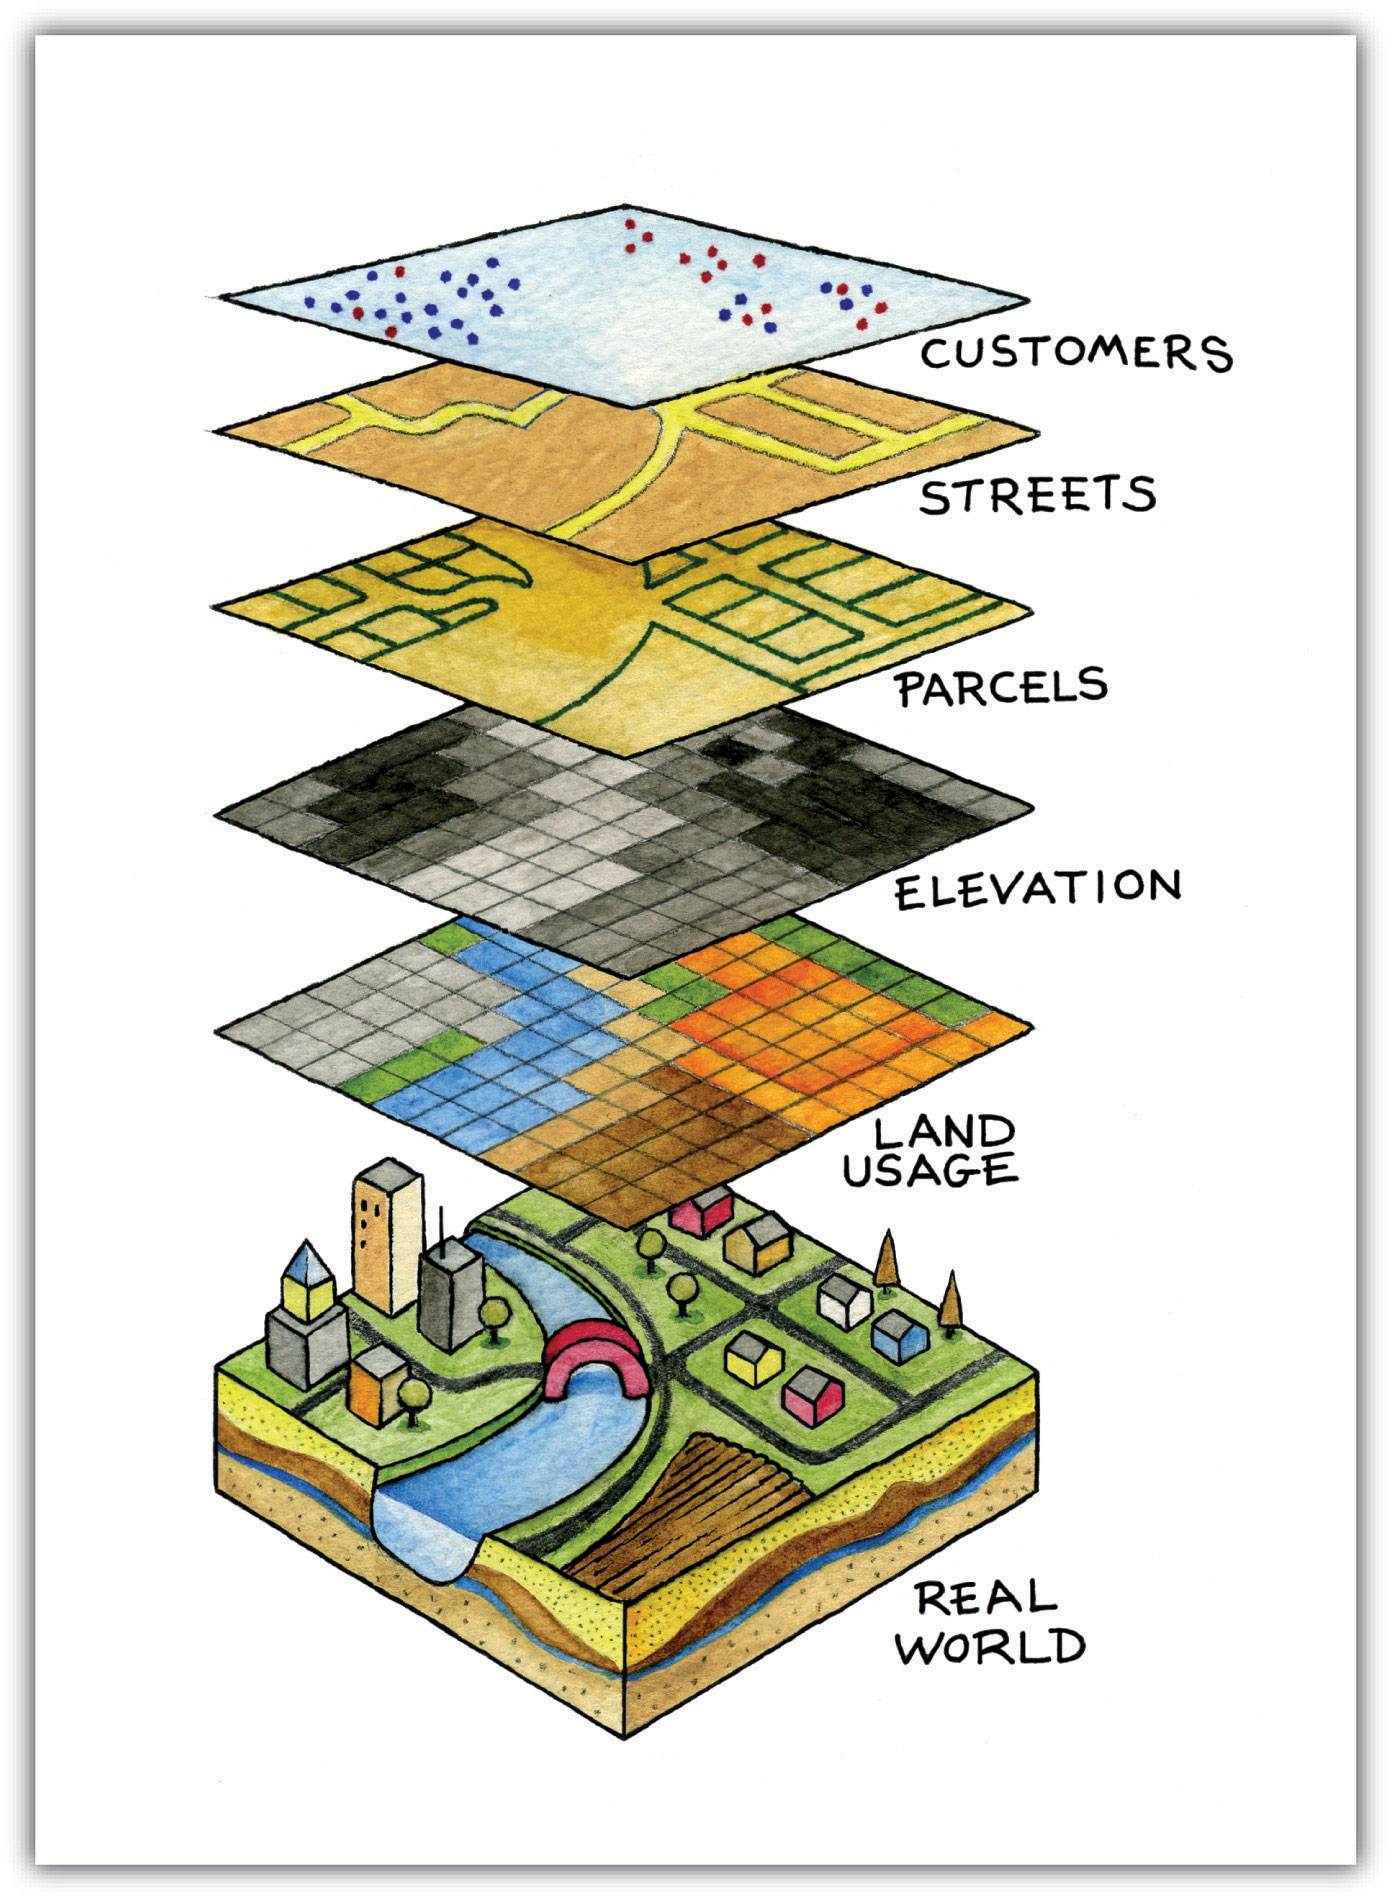
- Maps tell stories ...
... the story is about place and space - Maps are representations of reality
Location and attributes: spatial relationships
- Maps are performances
... and they have purpose - Maps are abstractions
symbolization and generalization
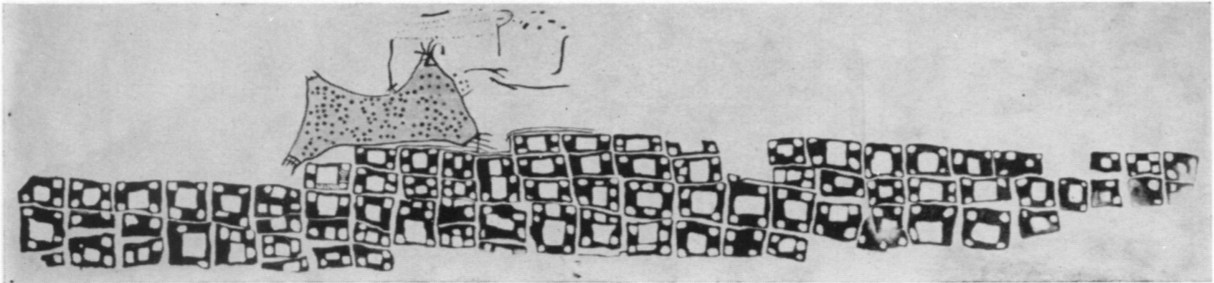
The 6200 BC “map” of Çatalhöyük in Turkey
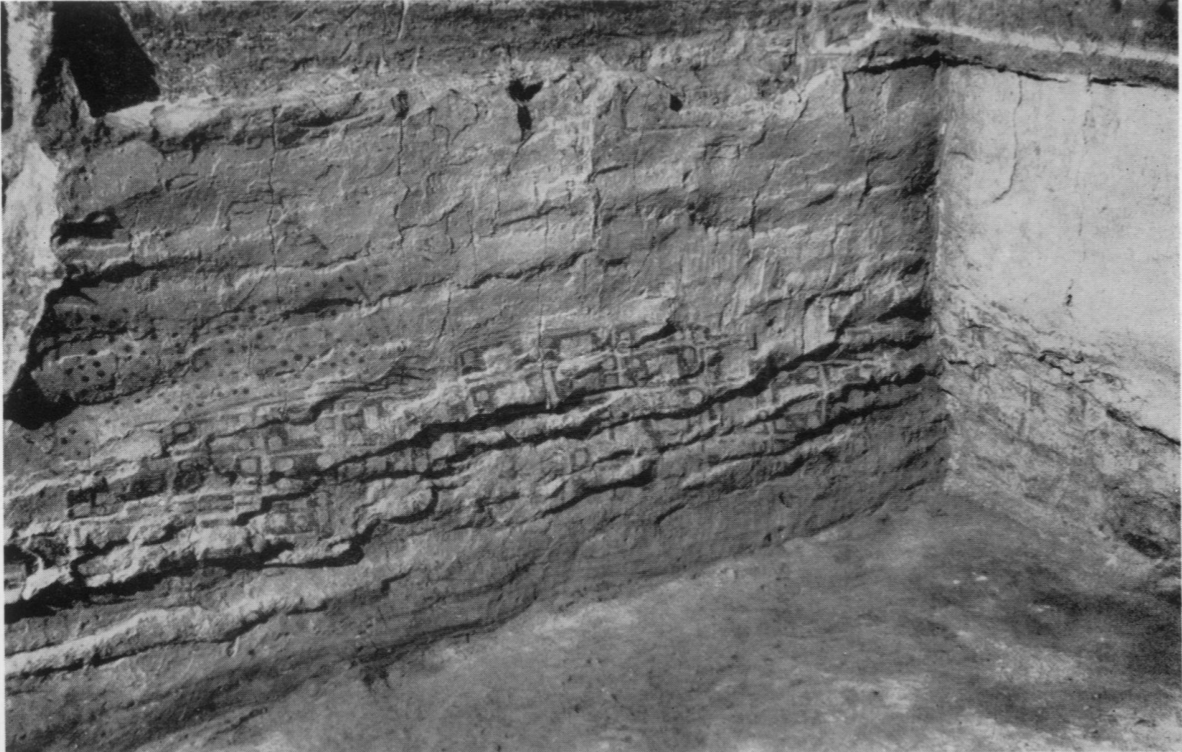
Is this a Map?
National Geographic made the map of the US based on translations of place names from their origins in Native American languages.
Hereford Mappa Mundi, Richard of Haldingham and Lafford, c 1300
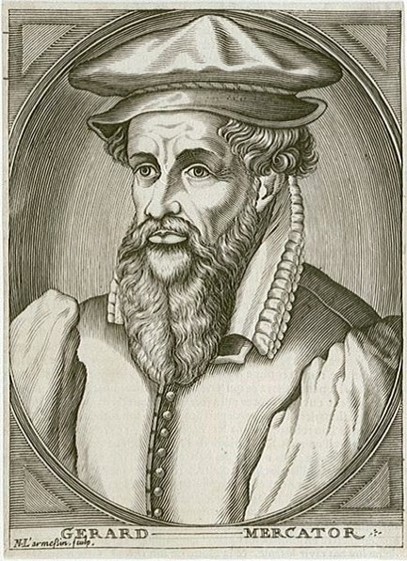
Gerhard Mercator, 1569
Napoleon's march on Moscow March 1812, Charles Joseph Minard
When a large outbreak occurred in London in 1854, Dr. John Snow created a map that settled a debate between two schools of thought: that cholera is transmitted not through the inhalation of infected air, but through the ingestion of contaminated water or food.
credit: Erica Fischer - 2012
map credit: infrapedia
Ovenden, M. (2005). Metro Maps of the World. Capital Transport Pub, London. Cartography by Alan Foale of LS London.
UM Office of Civic Engagement and the UM Institute for Data Science and Computing. Miami Affordability Project. https://map.idsc.miami.edu/ (accessed 2022-06-22).
Climate Central. Coastal Risk Screening Tool: Land Below 10.0 Feet of Water. https://coastal.climatecentral.org/ (accessed 2022-06-22).
Climate Central. Stakes Rising: 2100. https://stakes.climatecentral.org/
(accessed 2022-06-22).
Climate Central. Extreme Scenario 2100. https://xs.climatecentral.org/
(accessed 2022-06-22).
Savino Miller Design Studio (2022). Adaptation Plan: Little River Adaptation Action Area 16. https://adaptation-action-area-in-little-river-mdc.hub.arcgis.com (accessed 2022-06-24).
Savino Miller Design Studio (2022). Adaptation Plan: Little River Adaptation Action Area 16. https://adaptation-action-area-in-little-river-mdc.hub.arcgis.com (accessed 2022-06-24).
UM Drone Survey (2022-04-04)
UM Tree Inventory (ongoing)
- What stories will you tell with maps?
- Tension between fiction and reality, map and territory
- The critical turn in cartography - maps and power
- Story (imaginative) vs. grid (lack of imagination)
- Maps as navigational tools for data as well as the world
- Maps are more interesting than reality?
- Geographic Information System
- collections of tools, data, hardware, and people
- Geographic Information Science
- systematic inquiry into research questions about the relationship between GIS and socio-natural systems
- Geographic Information conStruction
- tool building for storage, collection or analysis of geospatial data
Wright, D. J., Goodchild, M. F., & Proctor, J. D. (1997). Demystifying the Persistent Ambiguity of GIS as ‘Tool’ versus ‘Science’.
Annals of the Association of American Geographers, 87(2), 346-362. doi:10.1111/0004-5608.872057
The system of organization can be digital (software) or analog (drawn on paper).
The actual process of organization is done with a purpose by human beings.
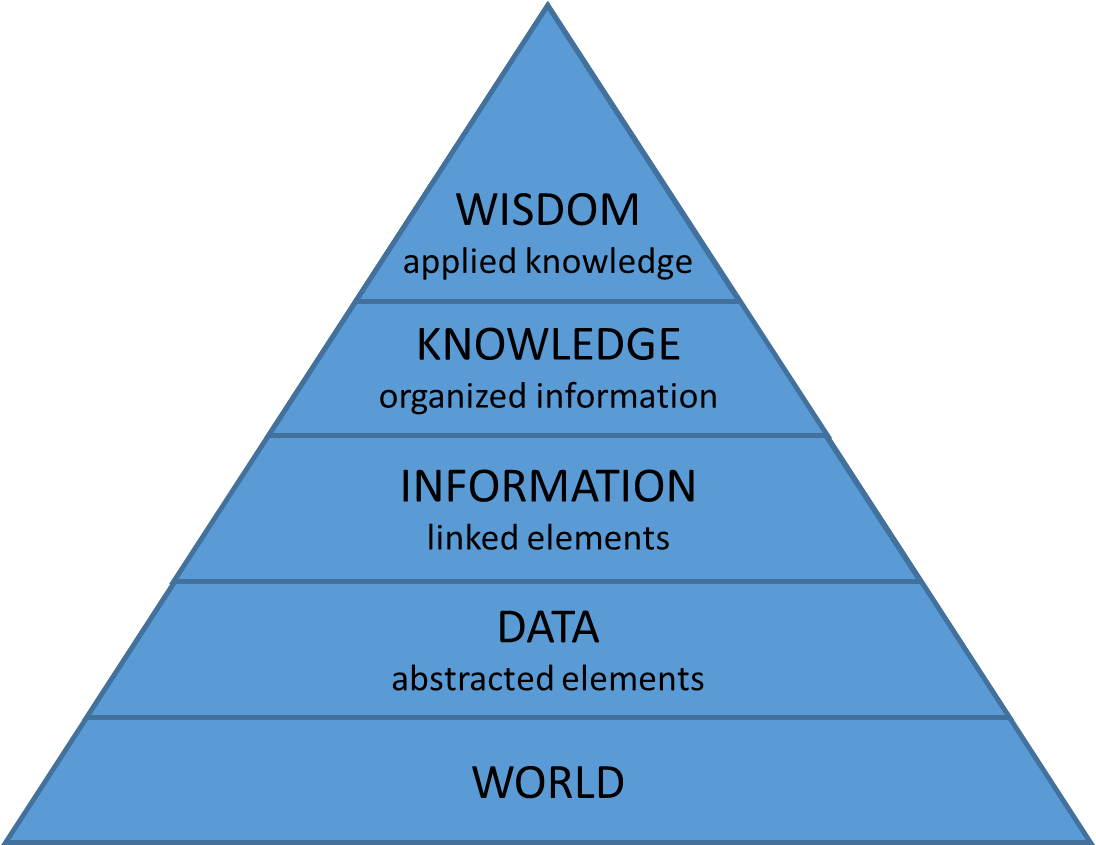
- Physical Model
(files on disk) - Logical Model
(data structures - vector and raster) - Conceptual Model
(discrete or continuous) - Reality
(the world out there)
- Tool set
- collection of software programs
- in some cases referred to as a stack
- Data model
- Relational databases (tables)
- Extensible data models (trees)
- Raster data (images)
- Scripting/programming languages
- Tool set
- ArcGIS Desktop
- ArcGIS Pro *NEW*
- Relational data model
- shapefiles (.shp)
- geodatabases (.gdb)
- geotiffs (.tif)
- database servers (SQLServer, posgreSQL)
- Scripting languages
- python
- Tool set
- QGIS - http://www.qgis.org/en/site/
- base: Geospatial Data Abstraction Library (GDAL)
- base: Open GIS Reference (OGR)
- Relational and Tree data model
- shapfiles (.shp) (relational)
- json (.geosjon) (trees)
- geotiffs (.tif) (raster)
- relational database servers (postgreSQL, oracle)
- Scripting languages
- python
- Tool set
- Python - https://www.python.org/
- R - https://www.r-project.org/
- packages: GDAL/OGR, geopandas, ggplot, sp
- leaflet for visualization
- Physical and logical data models
- raw text, csv (tables)
- raw text, json, geojson (trees)
- raw text, grids (raster)
- relational databases (sql)
- Scripting languages
- Python
- R
University of Miami Resources
- for an ESRI account contact Abraham Parrish (GIS Librarian): aparrish@miami.edu
- for Library GIS resources see http://sp.library.miami.edu/subjects/gis
- for Geography department resources contact Chris Hanson (GIS lab manager) hansonc@miami.edu
- for ArcGIS Pro contact Maria L. Estevanez (RSMAS) mestevanez@rsmas.miami.edu
- for FOSS GIS contact Timothy Norris (UML/IDSC) tnorris@miami.edu
|
|
|
|
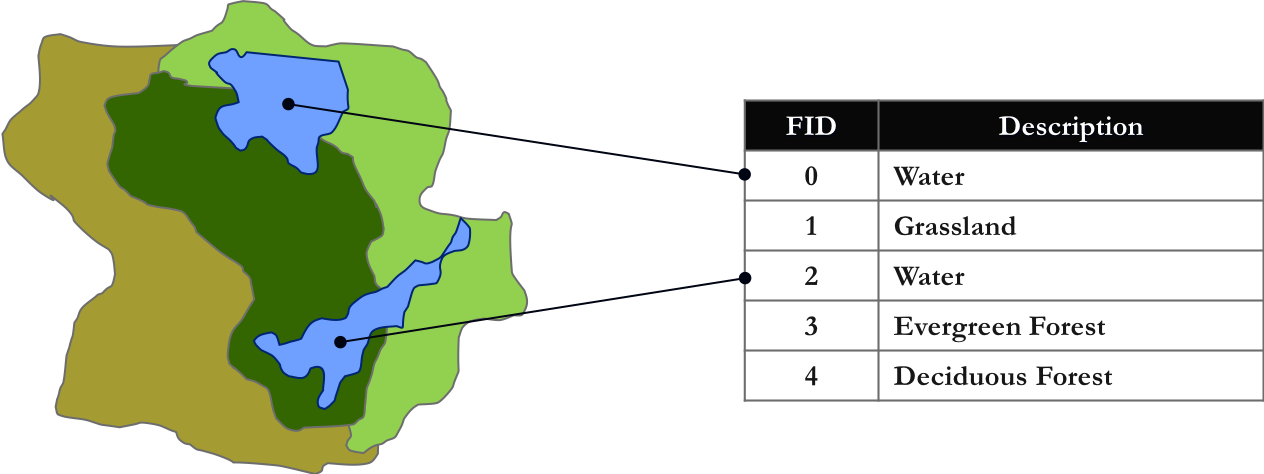
- Points, Lines and Polygons
- all based on x,y coordinate pairs of geographic data
- lines and polygons are built from groups of points
- attribute data is linked to points, lines, or polygons (features)
- each feature is associated with a unique record in an attribute table
- Common File Formats
| Name | Extension | Source |
| shapefile | .shp * | ESRI |
| geojson | .json | open |
| geodatabase | .gdb | ESRI |
| google earth | .kml | open |
| autoCAD | .dxf .dwg | AutoDesk |
(and more - be careful!!)
- Grids of Rows and Columns
- each cell represents an x,y coordinate
- each cell has a specific size on the surface of the earth (scale)
- cell scale is based on the resolution of the image
- each cell has only one value (color or categorical)
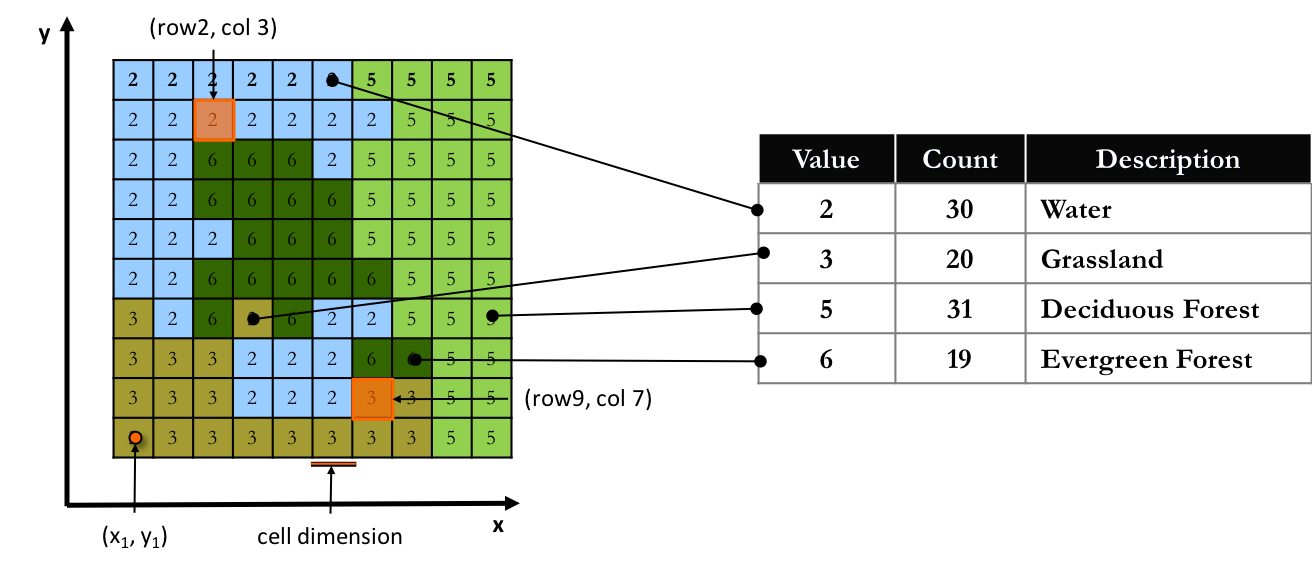
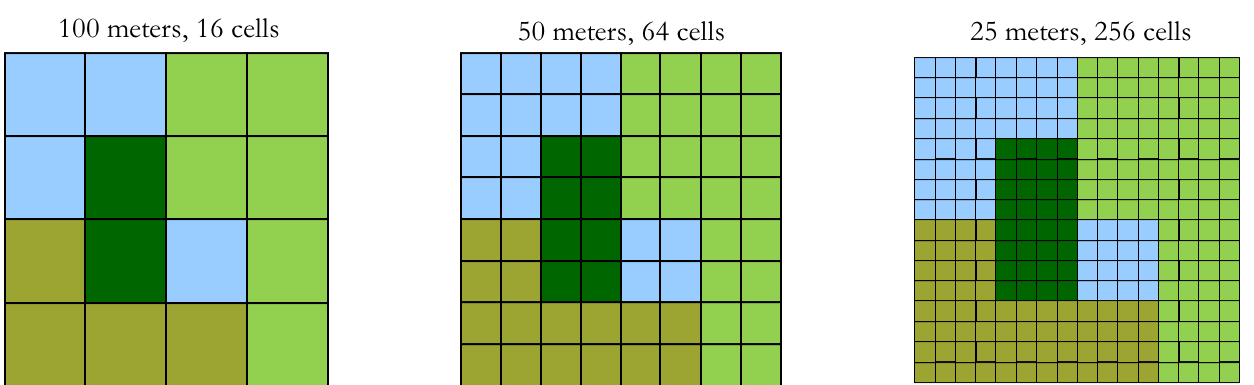
- Resolution
- Original resolution of the collected data limits spatial accuracy
- Can’t improve by replicating cells to create smaller size cells
- Location implied; rounded to cell coordinate (center of cell)
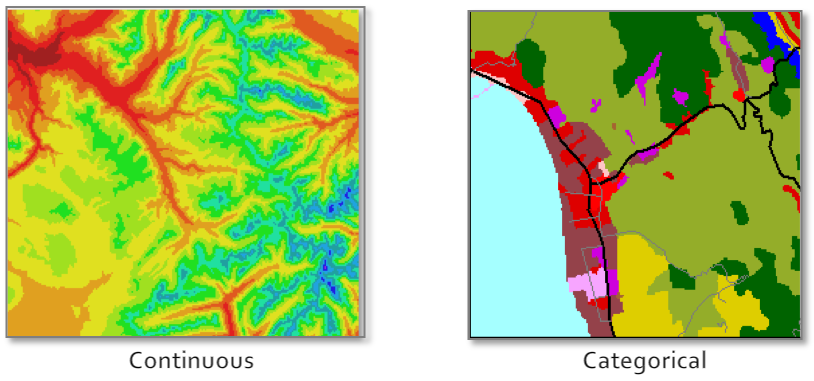
- Types of Data
- Continuous
elevation, temperature - Categorical/Discrete
land use
- Common File Formats
| Name | Extension | Source |
| geotiff | .tiff .tif | open |
| jpg | .jpg | open |
| Arcinfo GRID | ESRI | |
| ERDAS imagine | .img | ERDAS |
- In ESRI you have several choices - add basemap
- for QGIS, google search for ...
- NOT suitable for printing!! The real alternative is good raster data
- where?
- what (who)?
- how much?
- extent or area?
- [ when? ]
- distance between (travel time)?
- path of least resistance (route)?
- overlap of areas (jurisdictions)?
- areal statistics (demographics)
- land use / land cover change
- clusters (spatial statistics)
- interpolation
- [ why? ]
- watersheds (flows)
- traffic patterns
- pollution
- view sheds
- geo-fencing (buffers)
- scope of question (is it doable)
- scale and type of output (design question)
- visualization (print, online, etc)
- how will you get the data!!!
Coordinate Systems
Artistic cartography:
creative ways to peel the globe
- Datum
- Geographic coordinate system
- Projected coordinate system
- Geospatial data must have: datum + geographic coordinate system
- Projected coordinate systems are optional
(but needed for measurement)
- Center of the earth?
- That which is given?
- Ellipsoid
mathematically defined surface approximating the shape of the earth - Geoid
surface of the earths gravity field - approx sea level
- Latitude and Longitude - spherical coordinates
- Very common, but cannot be used for measurement
- Things to remember:
- ESPG - European Petroleum Survey Group
- WGS 84 - most common globally - ESPG:4326
- NAD 83 - most common in the United States - ESPG:4269
- meters or feet - Cartesian coordinates
- Used for measurement and mapping
- Things to remember:
- Projected Coordinate Systems are specific to the area being mapped
- In the USA: the "State Plane System"
- Around the Globe: the "UTM Grid"
- For web based mapping systems
WGS 84 Web Mercator - ESPG:3857
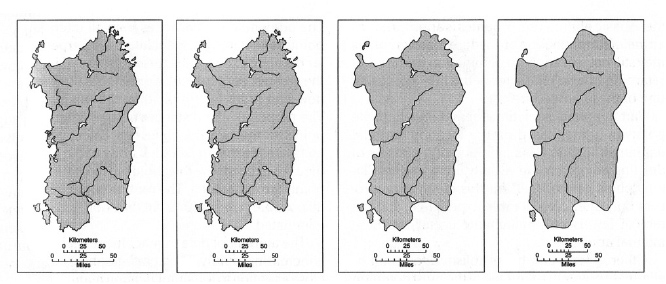
- Generalization
- The decision of what geographic phenomena are represented on the map
- Classification
- The decision of how to display attribute information that represents geographic phenomena
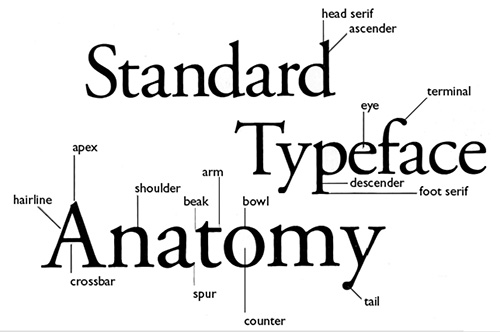
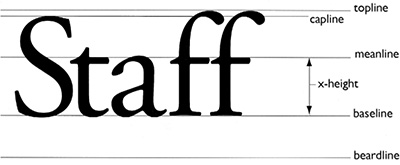
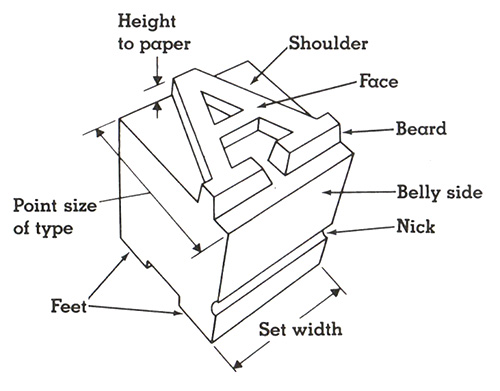
- Typography
- The decision of how to place words on a map
Purpose Matters
Words Matter
Monmonier, M. (1996 [1991]). How to Lie With Maps. Chicago, University of Chicago Press.
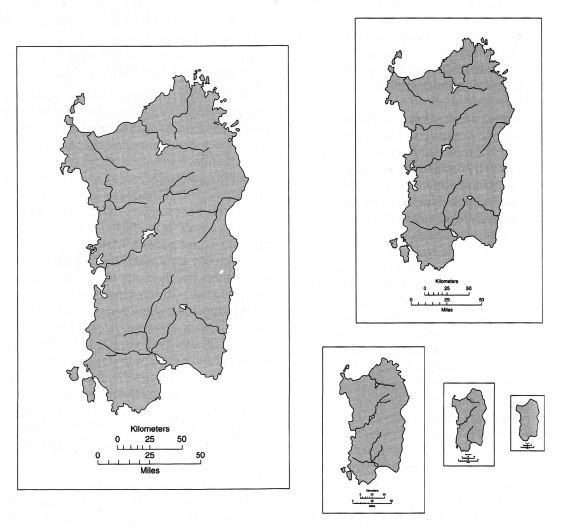
Scale matters: several examples of selection across different scales
Purpose matters: selection across constant scale where on the left physical geography is emphasized whereas on the right there is a base map good for showing attribute information of non-physical phenomena
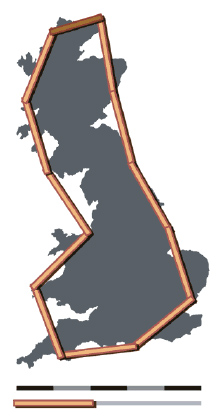
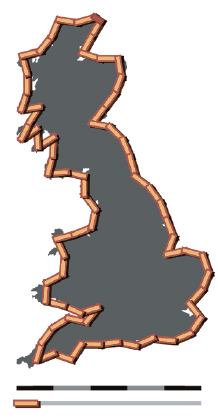
How long is the coastline of Great Britain??
Classification is not always desirable
-
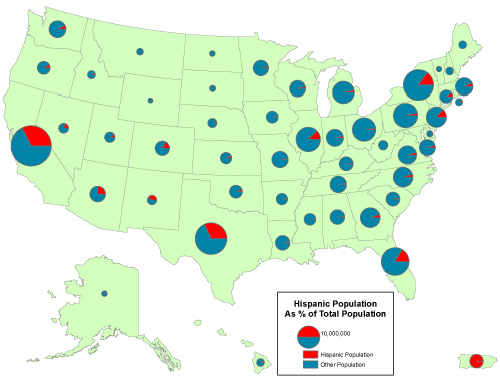
Attribute data directly linked to the visual variable
- the color is linked to the data (a satellite image)
- the size is linked to the data (a proportional symbol map) - For interval or ratio measurement
Classed: how many classes?
- Clorapleth: 5-7 is recommended
- Chorachromatic: < 7
- How to decide on class divisions?
A non-classed proportional symbol map. Note how you automatically class them in your mind.
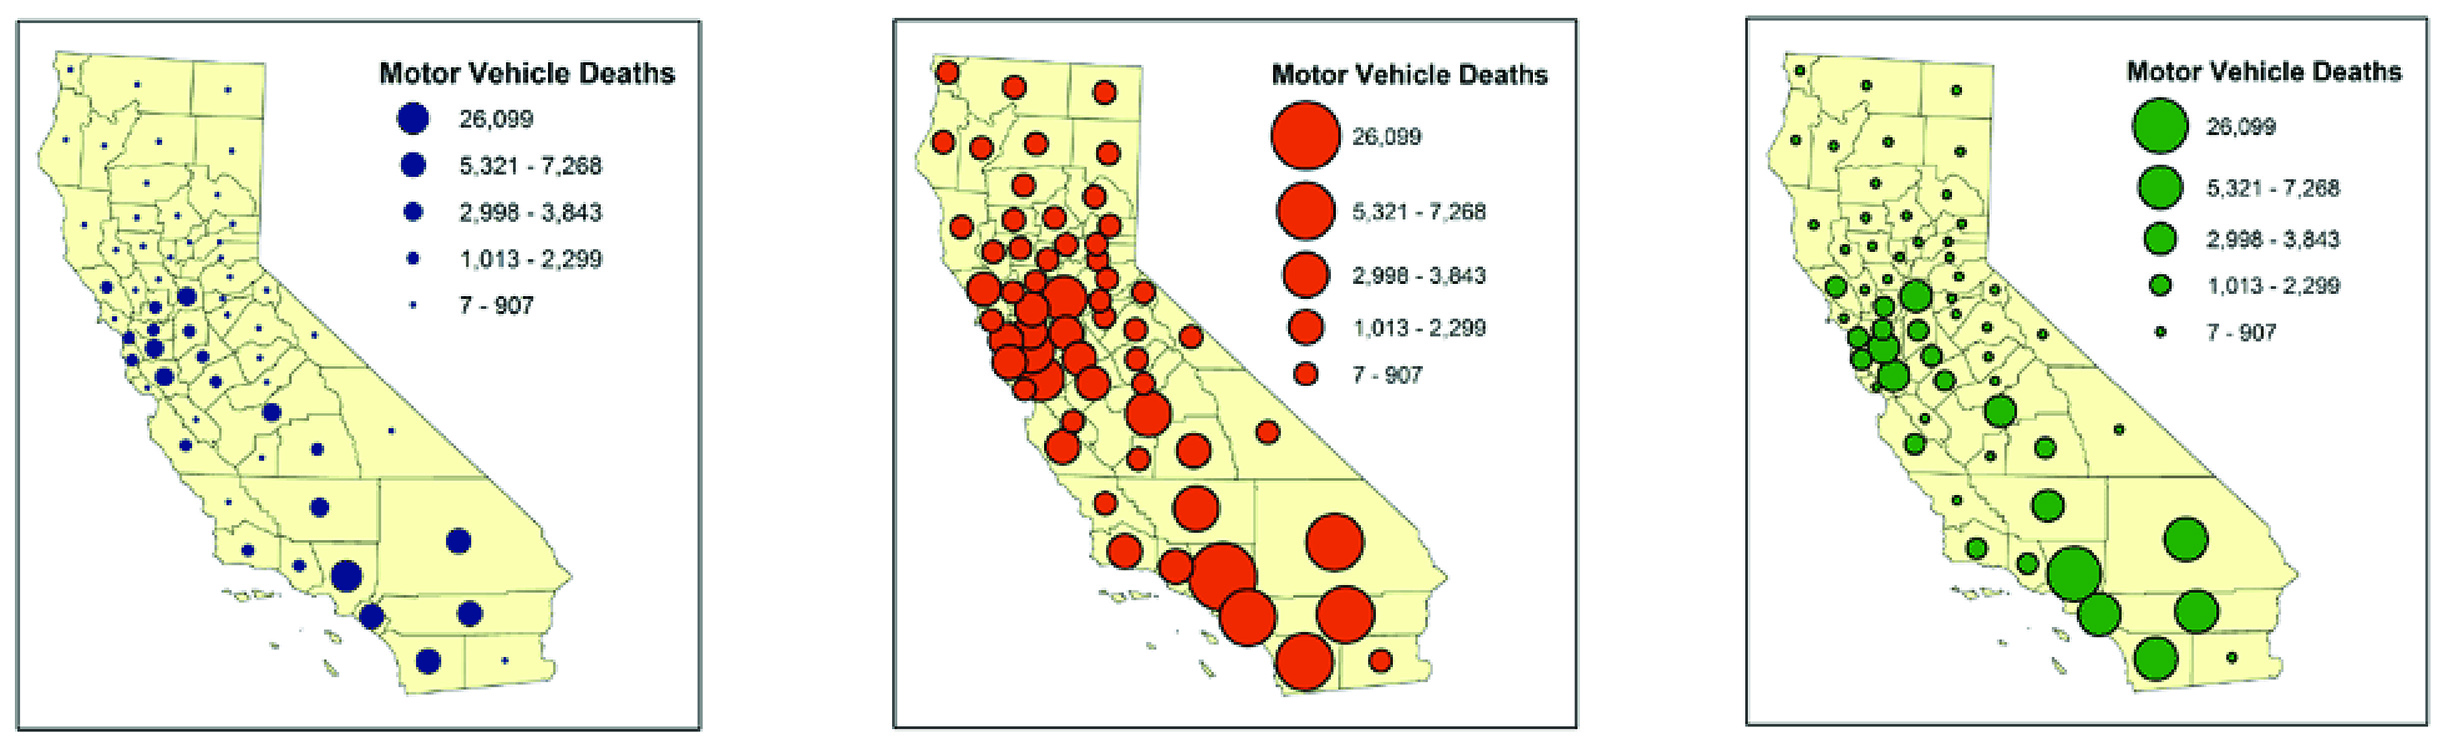

- Be careful with the range of sizes (above)
- Be careful of optical illusions (right)
map credit: joebstudio
More than you wanted to know, but . . .
What stories can we tell?
What future will we create?
Krygier & Wood (2016). Making Maps. Guilford Press, New York. pp 1 - 31.
Available for download.
Librarian Associate Professor, Data Science
University of Miami Libraries
Institute for Data Science and Computing
tnorris@miami.edu